- info@aagaminfotech.com
- Mon - Sat: 8.00 am - 7.00 pm


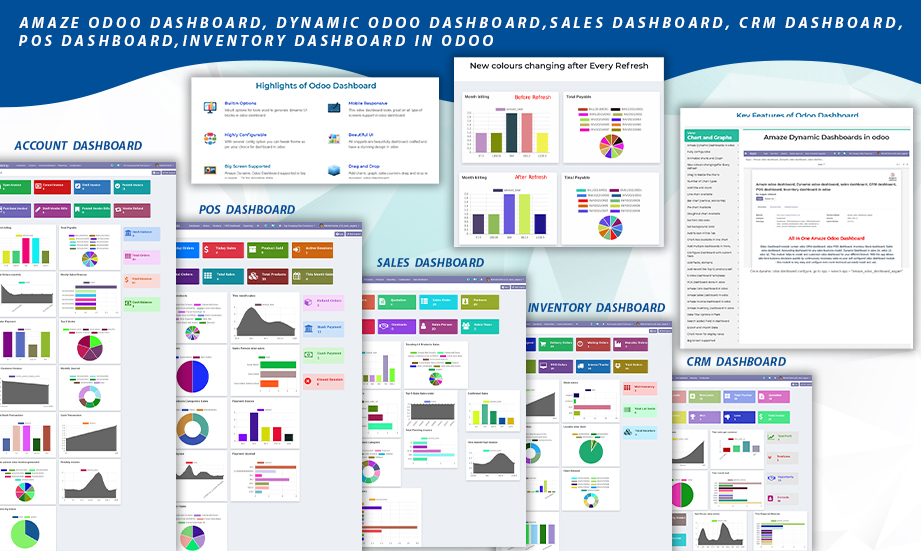
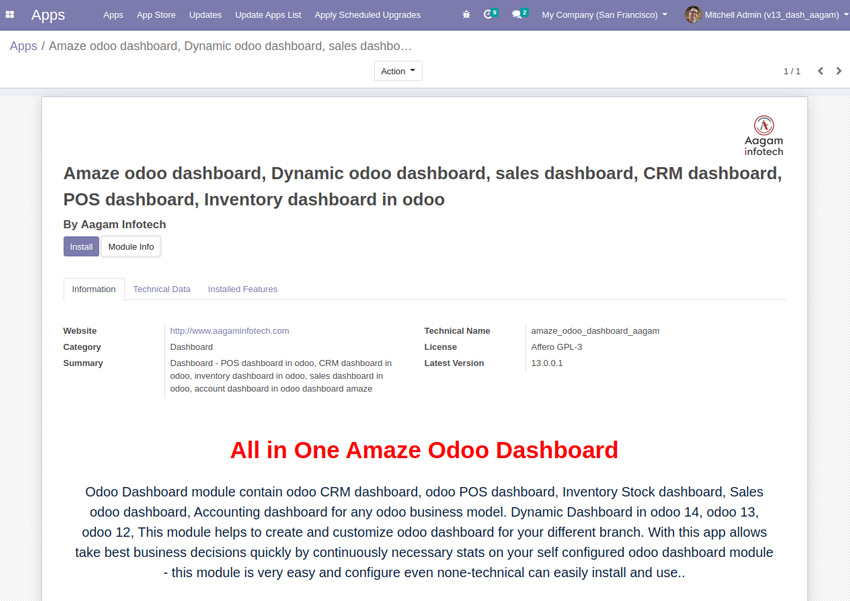
Amaze odoo dashboard, Dynamic odoo dashboard, sales dashboard, CRM dashboard, POS dashboard, Inventory dashboard in odoo
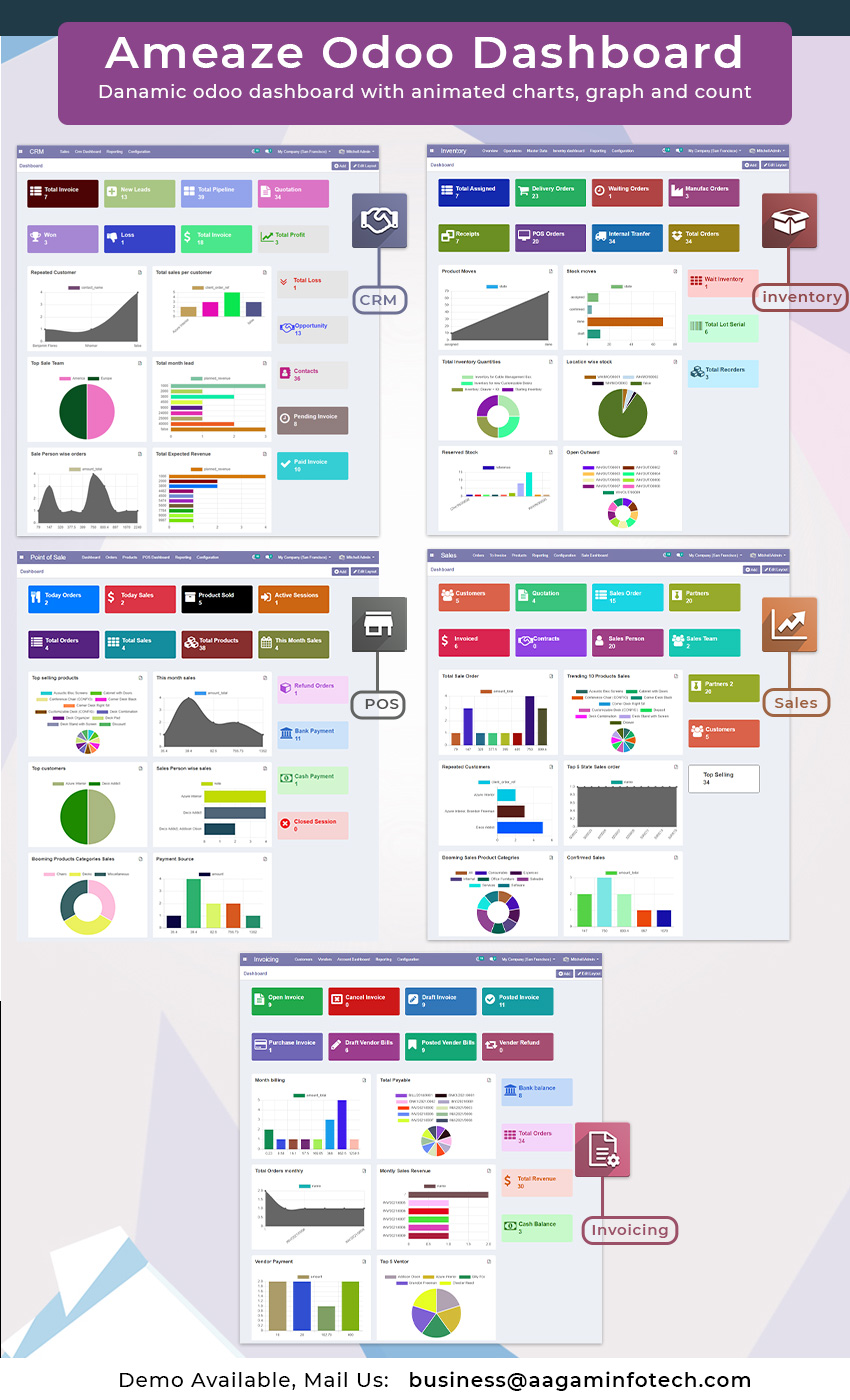
Amaze Dashboard – Odoo Dashboard Solution
Amaze Odoo Dashboard module contains odoo CRM dashboard, odoo POS dashboard, Inventory Stock dashboard, Sales odoo dashboard, Accounting dashboard, Invoice dashboard for any odoo business model. Amaze Dynamic Odoo Dashboard available for odoo 14, odoo 13, odoo 12, This dashboard module helps to create and customize odoo dashboards for your business. With this app allows take best business decisions quickly by continuously necessary stats on your self configured odoo dashboard module – this module is very easy and even non-technical can also easily install and configure it. odoo dashboard youtube video demo and live demo is available for dynamic odoo dashboard
Highlights of Odoo Dashboard

Responsive Dashboard
Amaze odoo dashboard support all types of screens for display dynamic dashboard

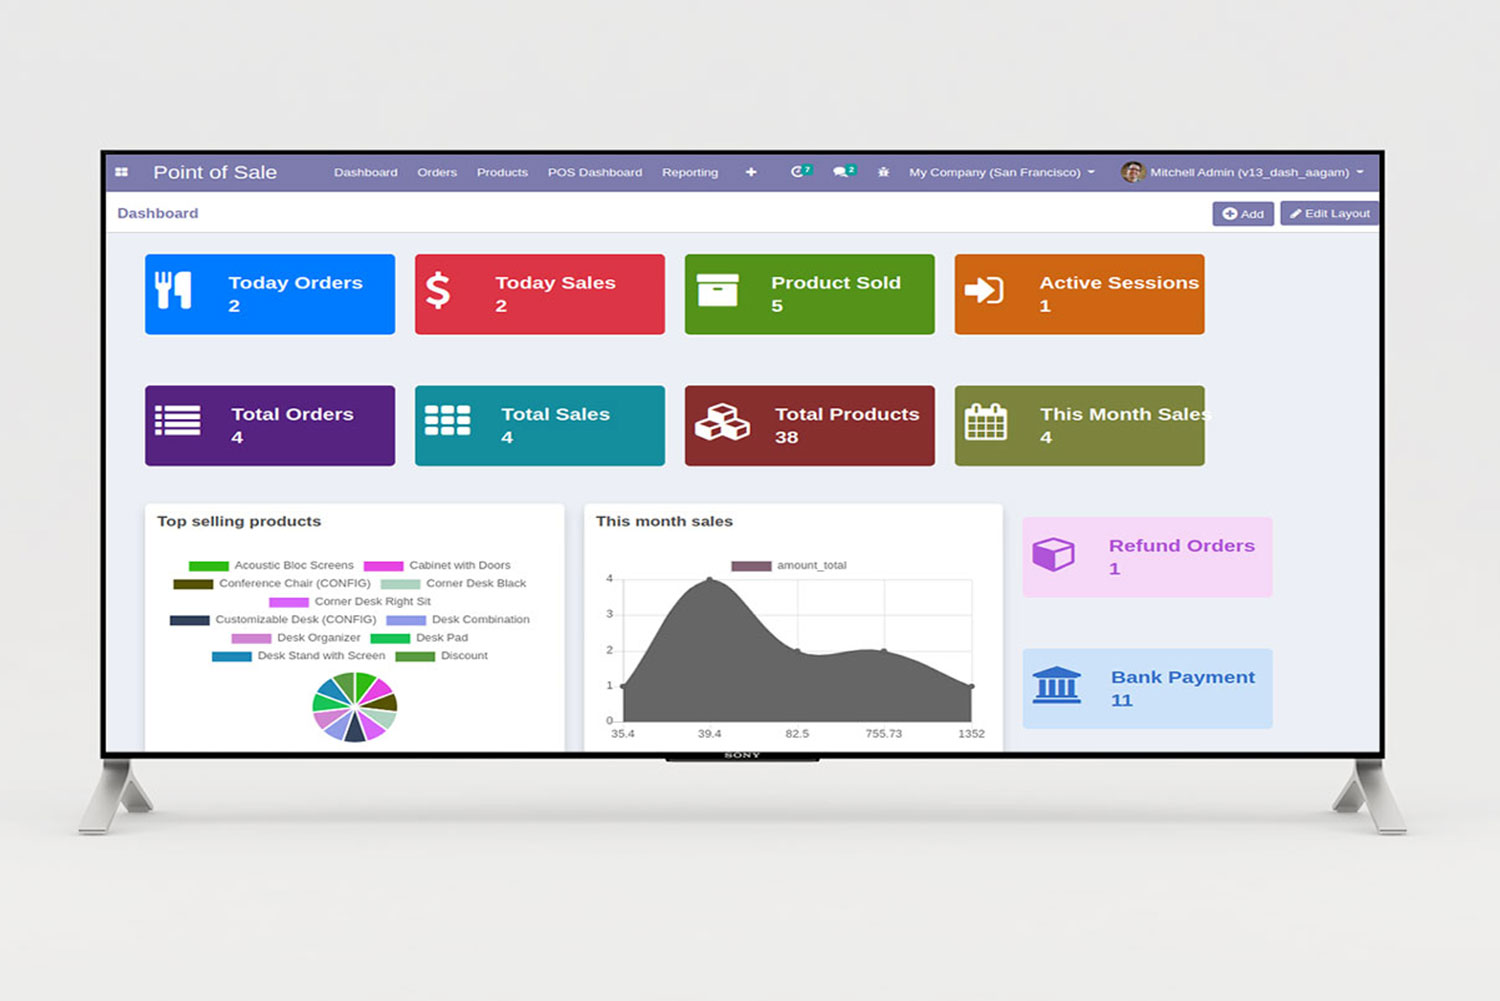
Big Screen Supported
Majorly all devices like Mobiles, Tablet, Laptop, Large screen, Desktop, TV Screen supported for dashboard view.

Drag and Drop
Edit layout option given in dashboard configuration to drag and resize the charts/list view displayed data.

Beautiful UI
We have given in built option for heading, title color, background color, fa icons, and multiple chart types for displaying Beautiful UI of dashboard.

Supported Charts
Pie Chart, Horizontal chart, Line chart, Bar Chart, Area Chart, Pie Chart, Doughnut Chart.

Easy Configurable
Easily configurable Sales, CRM, POS, Inventory, Invoice, Account etc. Dashboards with its Charts/Graphs/Listview filtered data.

Support
Edit layout option given in Amaze dashboard support Community and Enterprise both. Also, it is available with odoo V14, V13, V12 version.

Builtin Features
Ready made Dashboards with Tile Pie Chart, Horizontal chart, Line chart, Bar Chart, Area Chart, Pie Chart, Doughnut Chart preconfigured setup. Title, Background color, fa icon setup are in-build.
Key Features of Odoo Dashboard
Installation Steps for Amaze Dynamic odoo dashboard
Login with Odoo.com and Download Amaze Dynamic odoo dashboard app named “amaze_odoo_dashboard_aagam” from odoo.com.
-
01
Place amaze_odoo_dashboard_aagam folder in your Add-ons folder.
-
02
Login with your odoo admin/backend. Click on Apps in odoo menu and Update Apps list. Type “amaze odoo dashboard aagam” in Apps search box.
-
03
You will find “amaze_odoo_dashboard_aagam” module in search, click on “Install” button to install the Amaze dashboard.
-
04
Once module installed you will start using Amaze dynamic dashboard for Sales, CRM, Account, Inventory, POS etc.
Odoo.sh Installation steps.
-
01
Put your amaze_odoo_dashboard_aagam folder in Github project folder which is associated with Odoo.sh
-
02
Push/Commit your project in Git.
-
03
Login with Odoo.sh and click on branch which you select for commit dashboard.
-
04
Odoo.sh automatically synchronize with your github account and get that module.
-
05
Click on “Connect” button on right side of that branch, it will open the link of your website, login with that website and Install module using above steps.
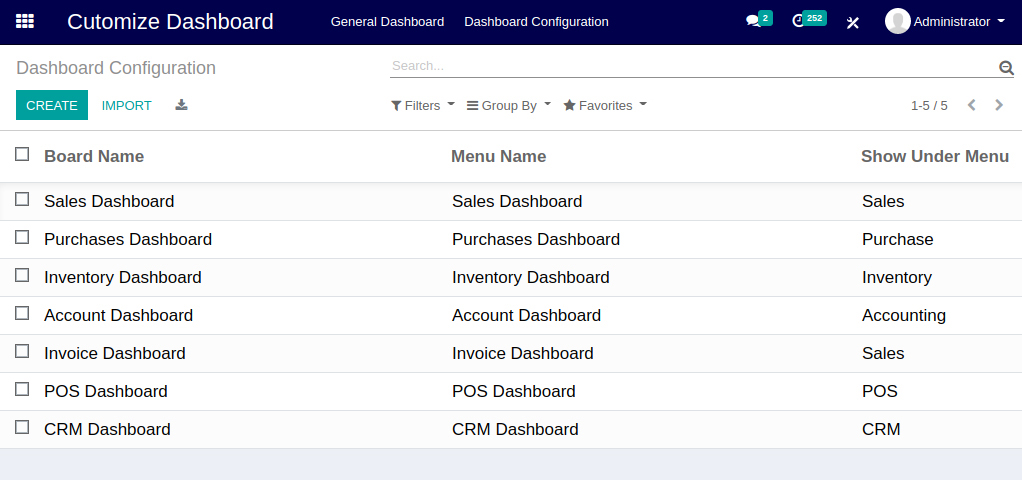
Multiple Pre-Configured Dashboards and Create Own Multiple Dashboards in Menu
-
01
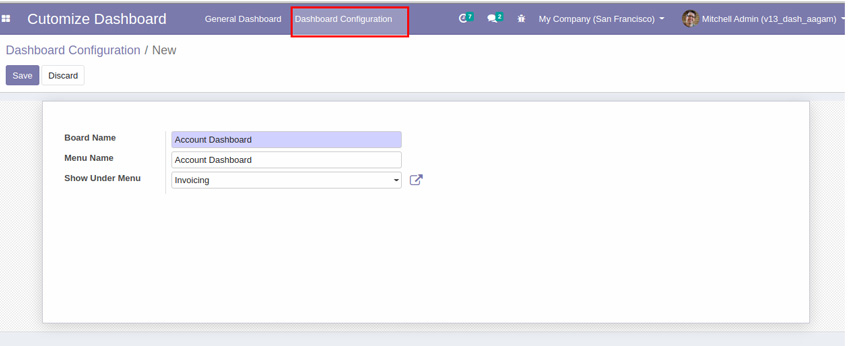
Amaze dashboard having default Sale Dashboard, CRM Dashboard, POS Dashboard, Inventory Dashboard, Account Dashboard added in Dashboard Configuration
-
02
Admin users, Internal user, Marketing Manager, Account Manager, Purchase Manager, Sales person can create their own dashboards as per their needs. They can setup BoardName with Menu and Sub Menu .
-
03
Import and Export options available for Dashboard configuration upload and download.
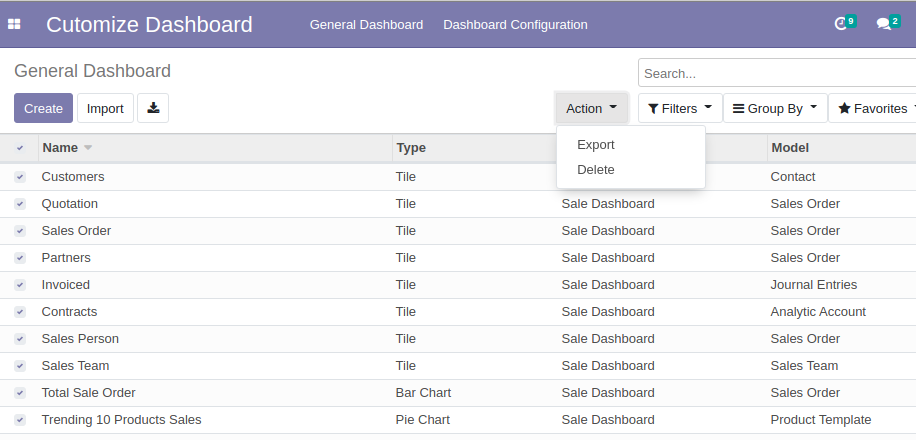
Create Chart/Graph/List View
-
Import/Export General Dashboard Chart Details
-
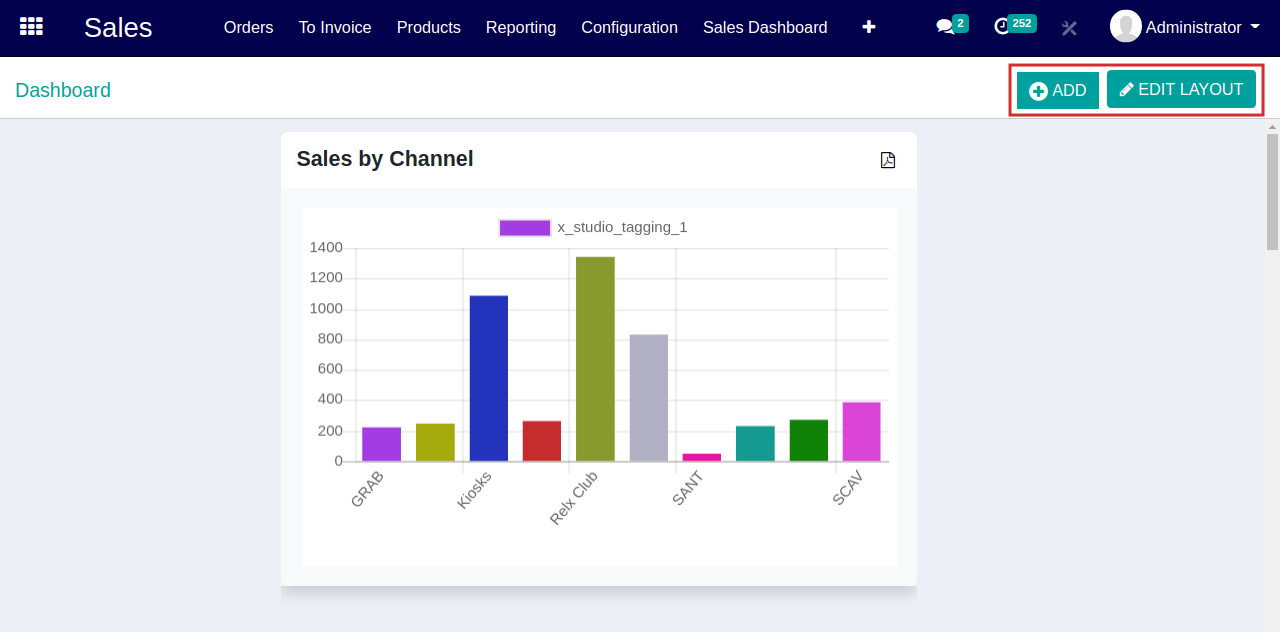
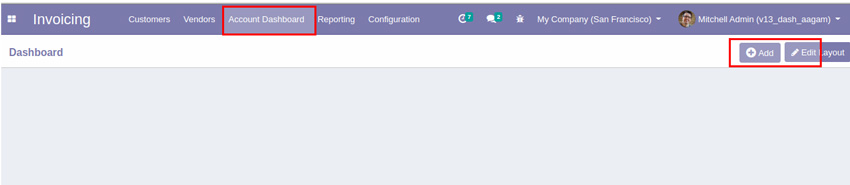
Add button option to Create New Chart/List View.
Edit Layout button option to drag, change Chart/List View Laout sizes.
-
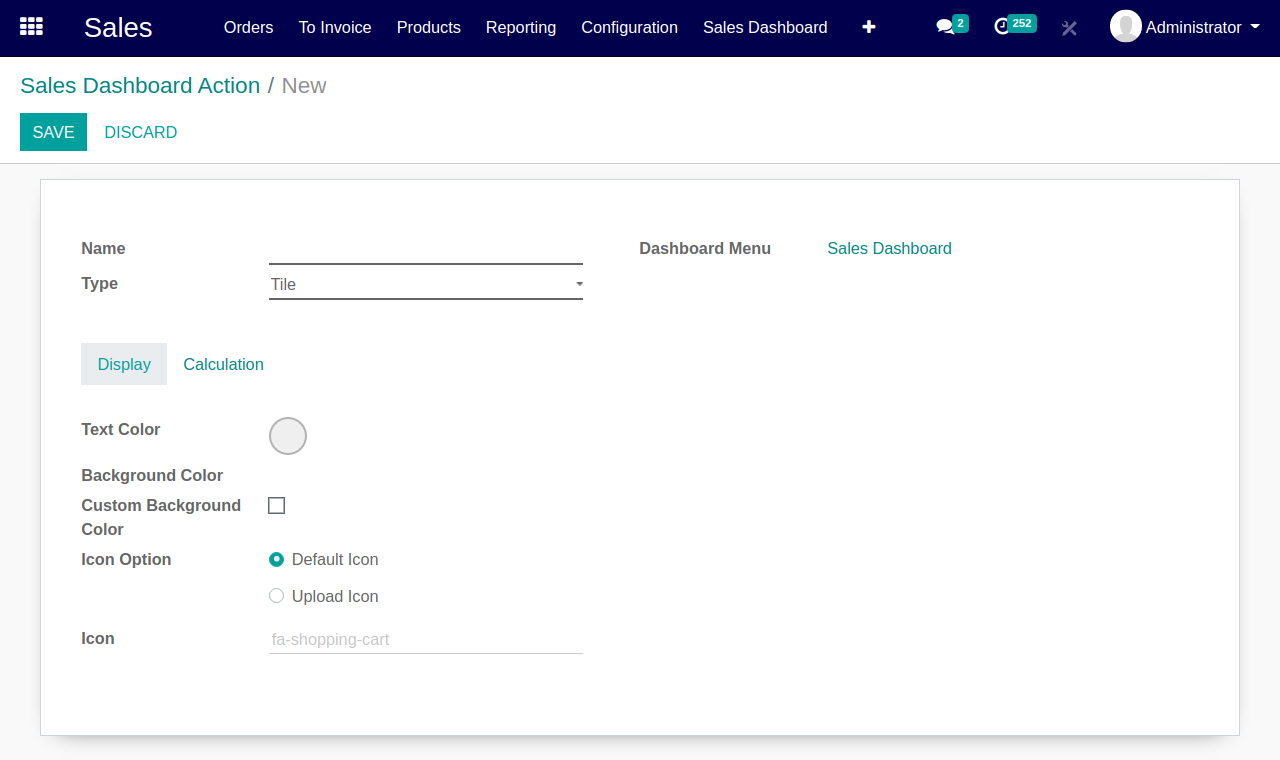
01
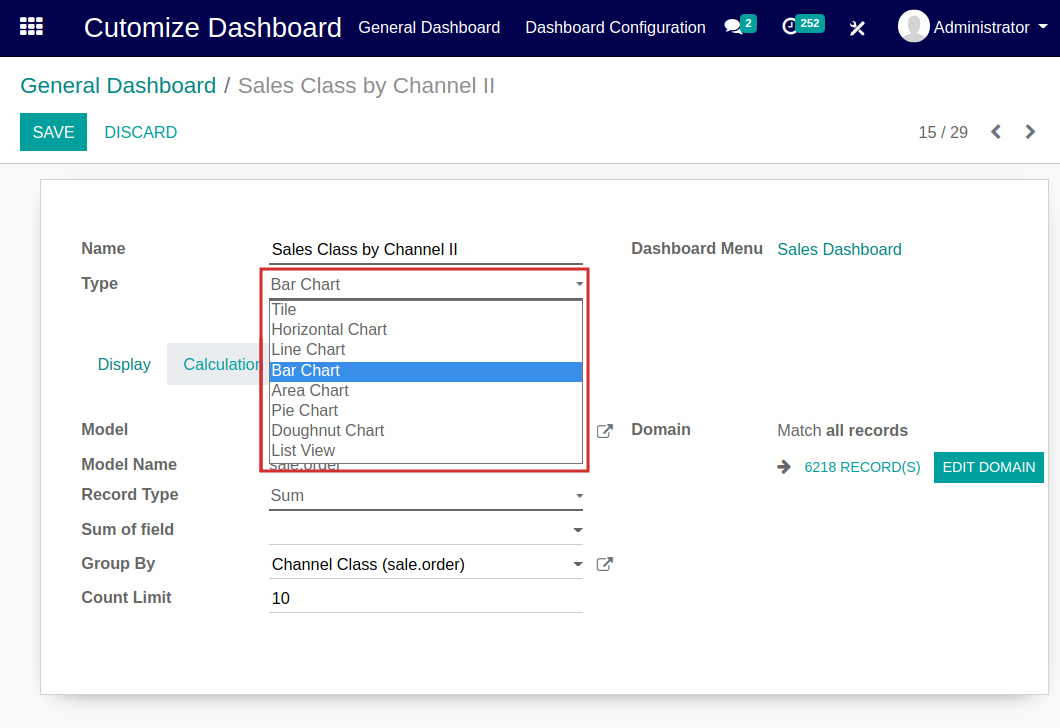
New blank Dashboard form view open for selecting different options to create chart. There are “Name” for Adding chart/List view Heading Title, Type for selecting Supported Types of chart/List view and also shows where it will be showed like in “Sales Dashboard” menu this chart will be displayed.
-
02
Two Tab options available for Display” and “Calculation”.
-
03
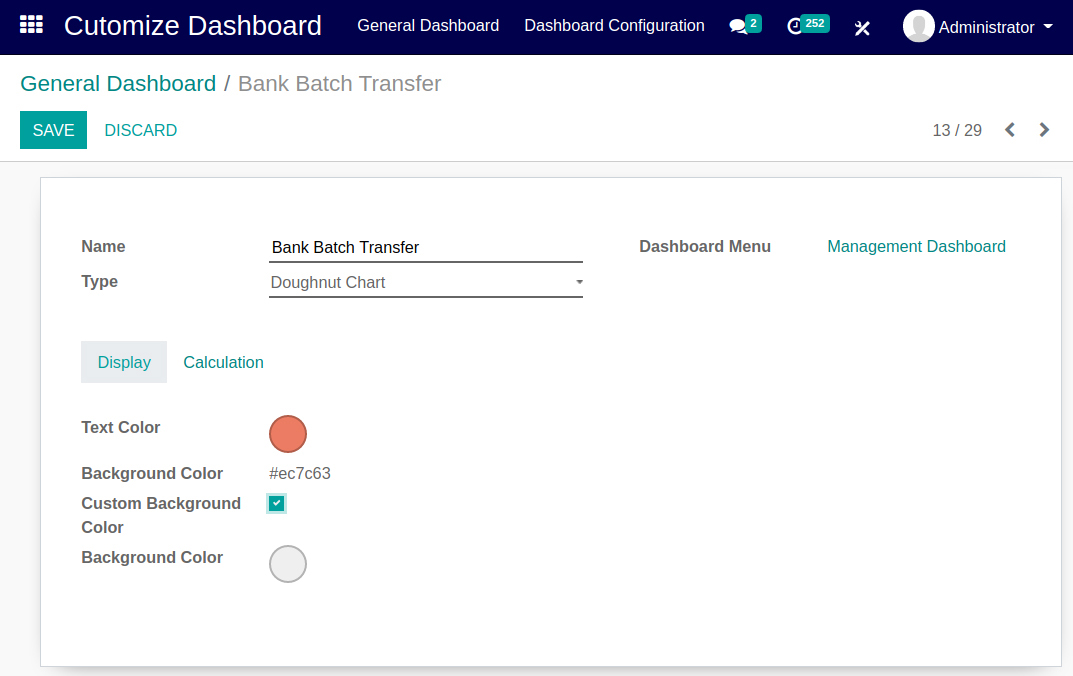
“Display” Tab used for graphical view of chart/list view dispaly. It use for setup title color of heading text, Background color of chart, upload fa icon for Tile.
-
04
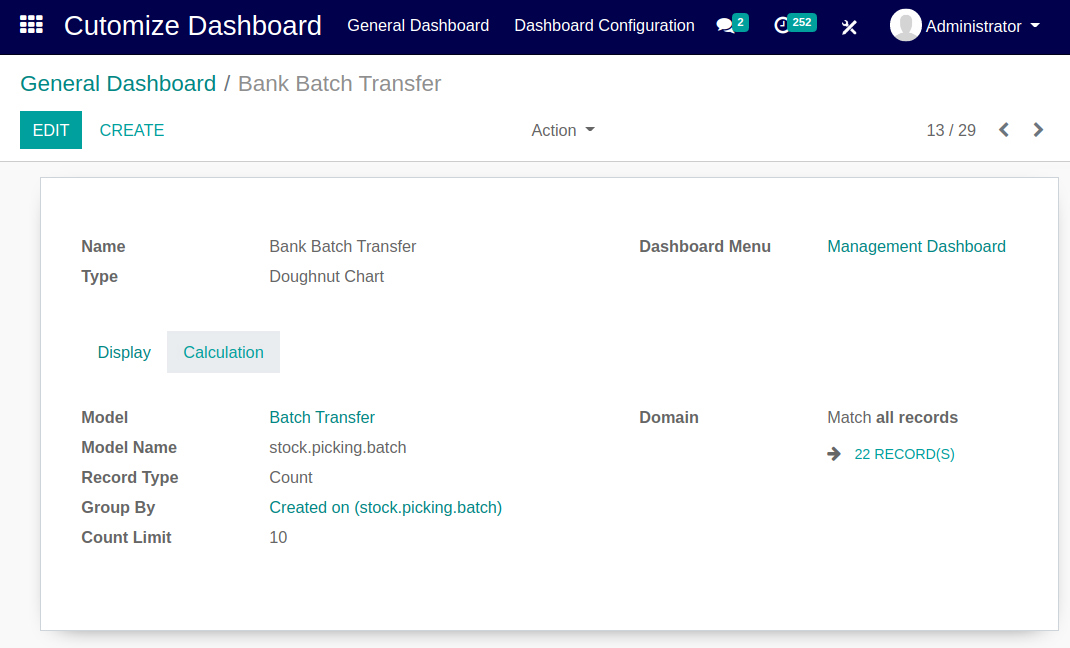
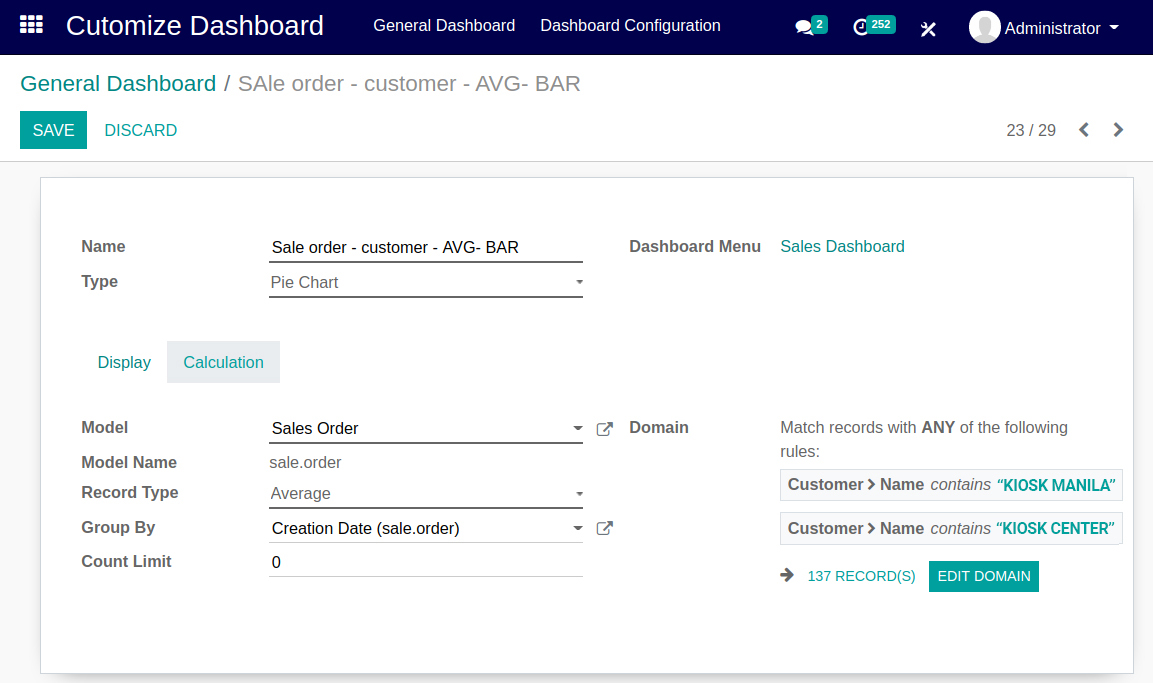
“Calculation” Tab used for selection various options for chart data display.
Calculation TAB Detail :
-
01
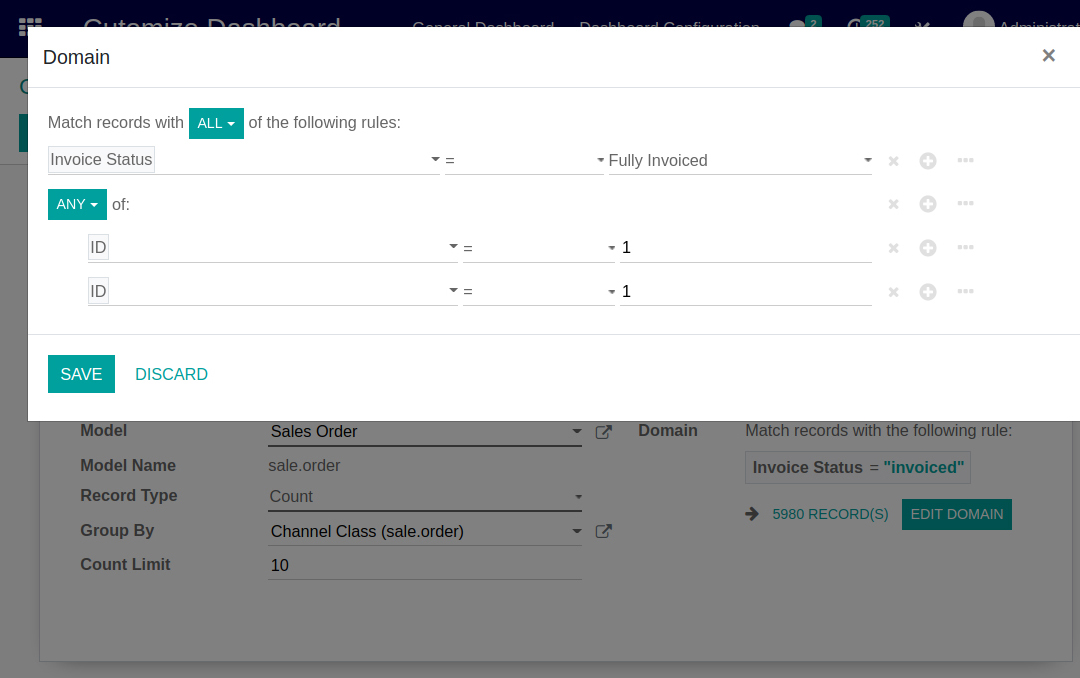
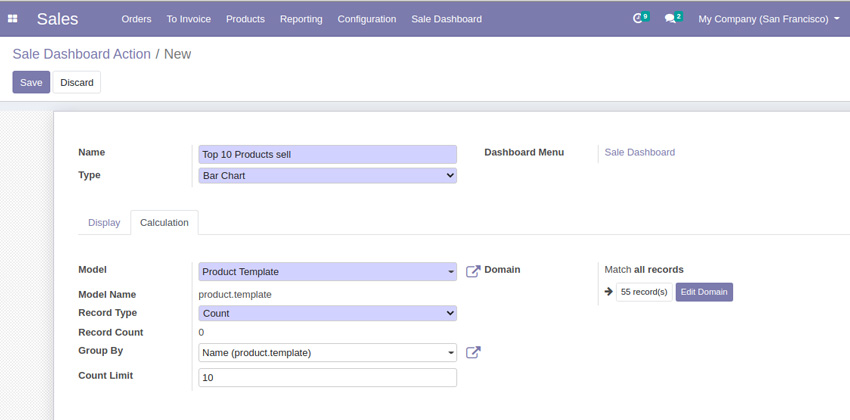
In Calculation TAB section multiple options available like Model (Model Name), Record Type (Count, SUM, AVG), Group By and Count Limit to display data for selecting criteria based Charts, Graphs and List View.
-
02
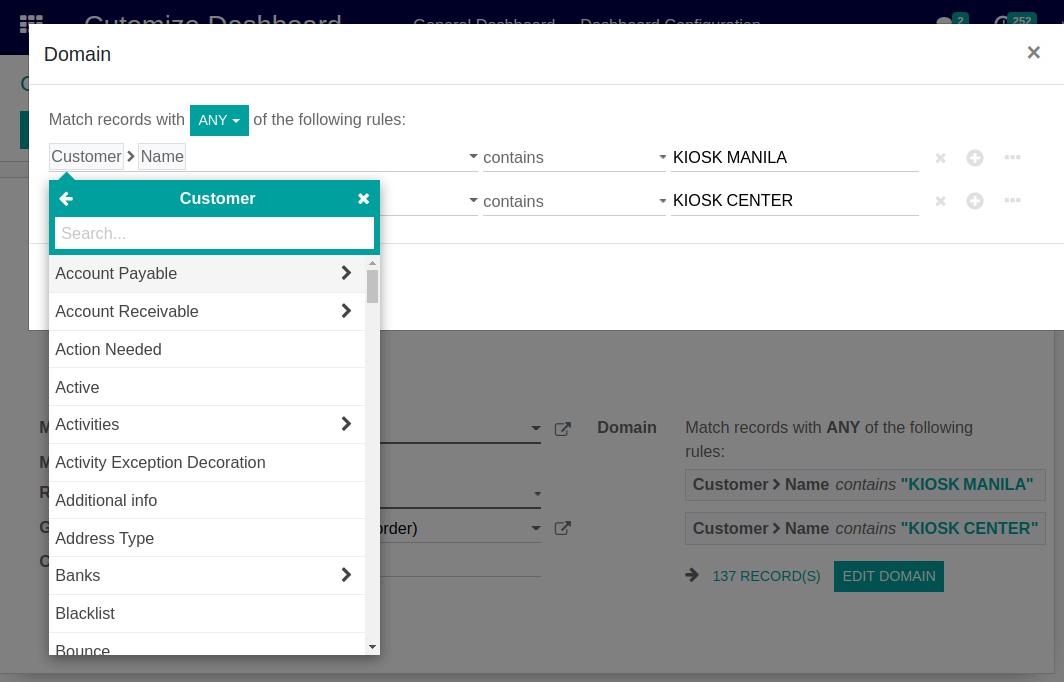
In the “Model” you can search and select Model Name, You can select “Domain” to select Model Name, In Group By you can search or Select Group by field for filtering data to display in chart.
-
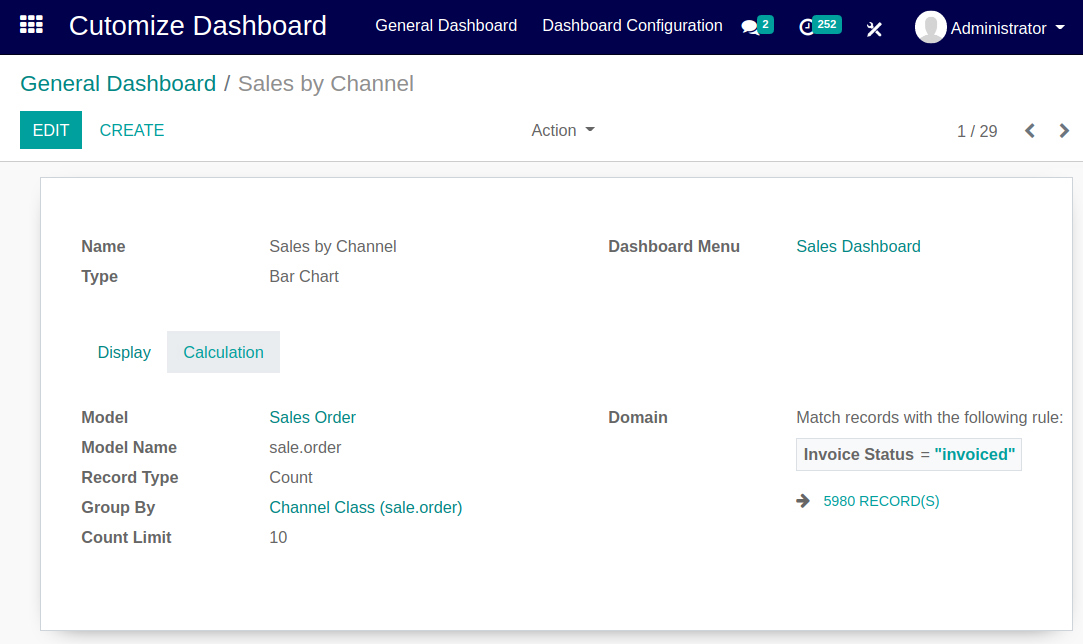
03
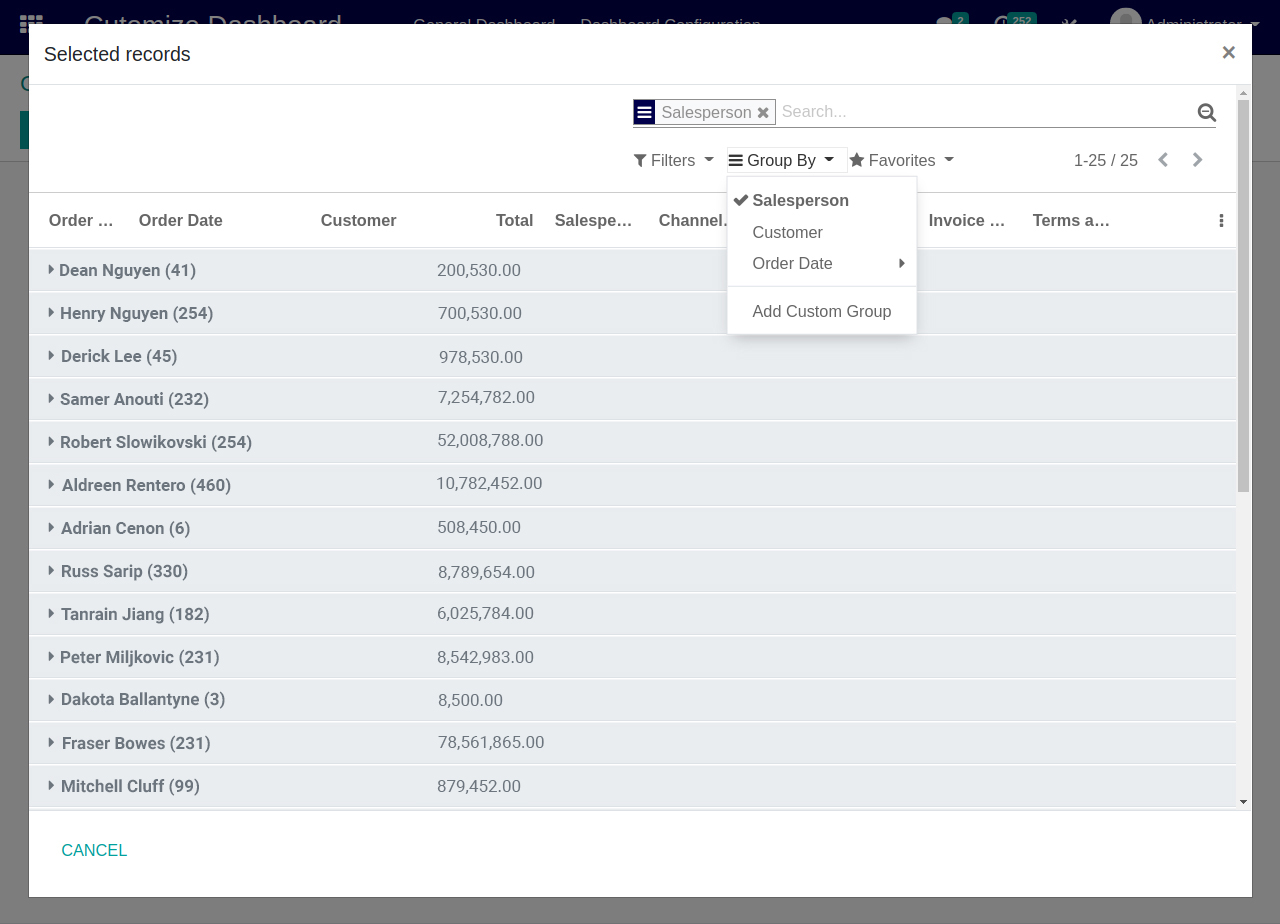
Once you select this criterias you will get number of Records in “Match all records” display.
-
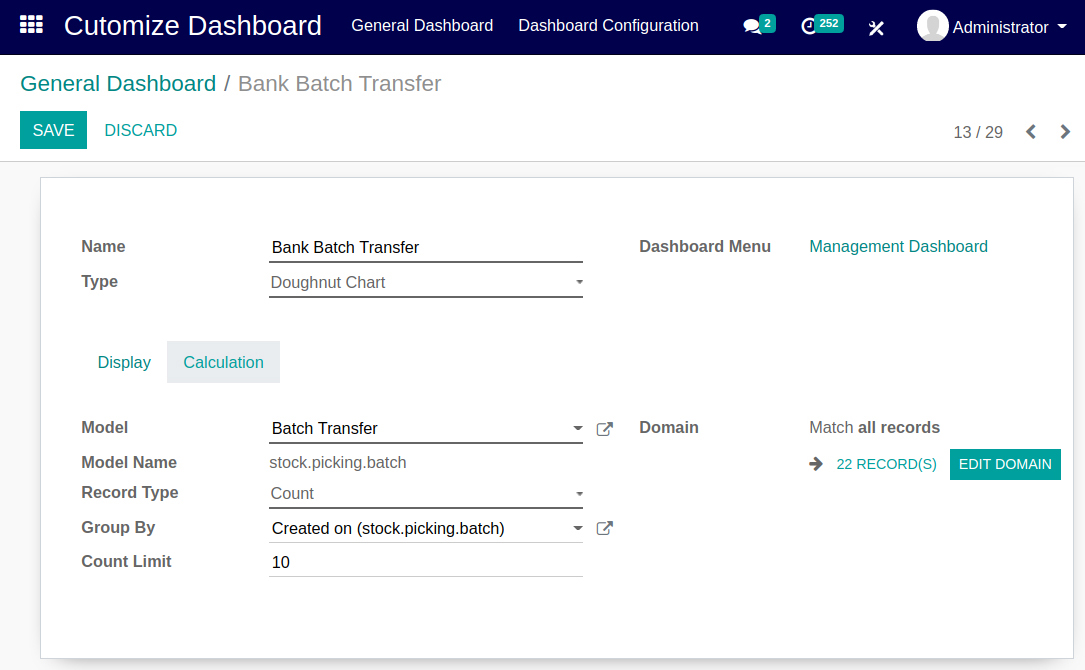
04
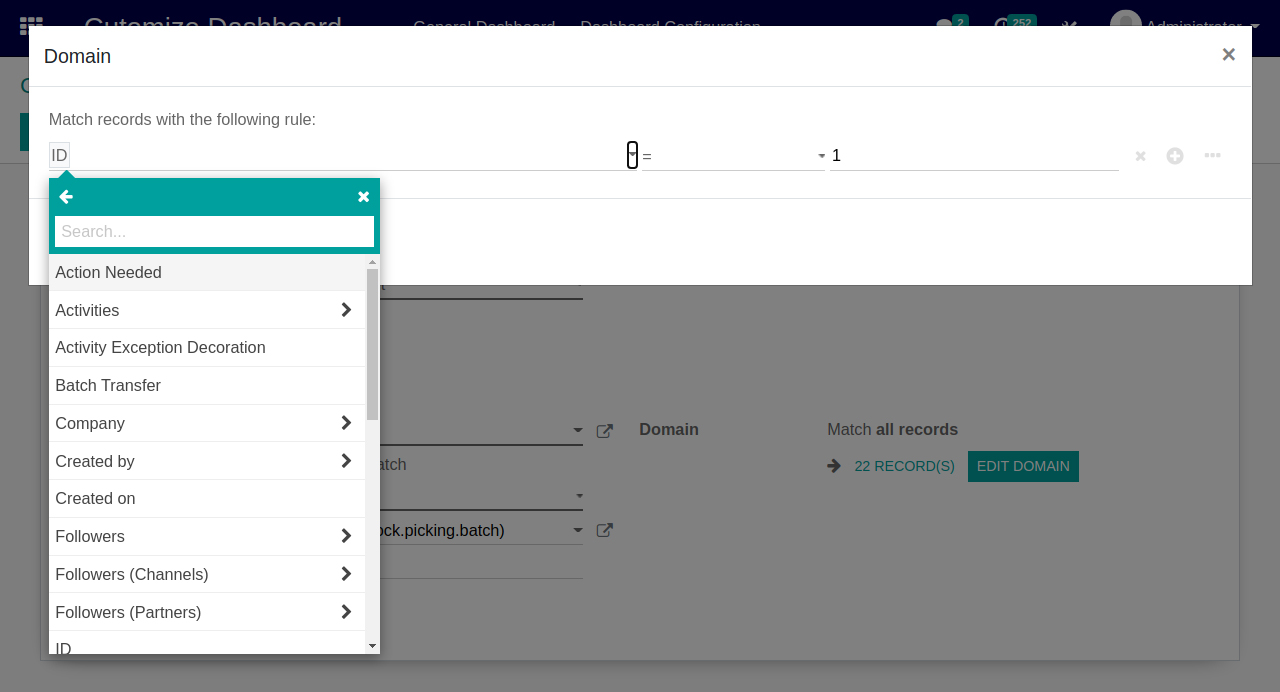
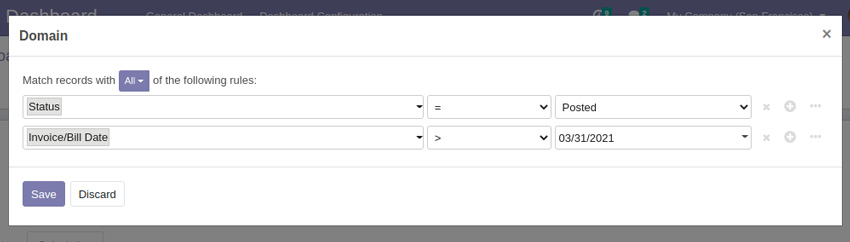
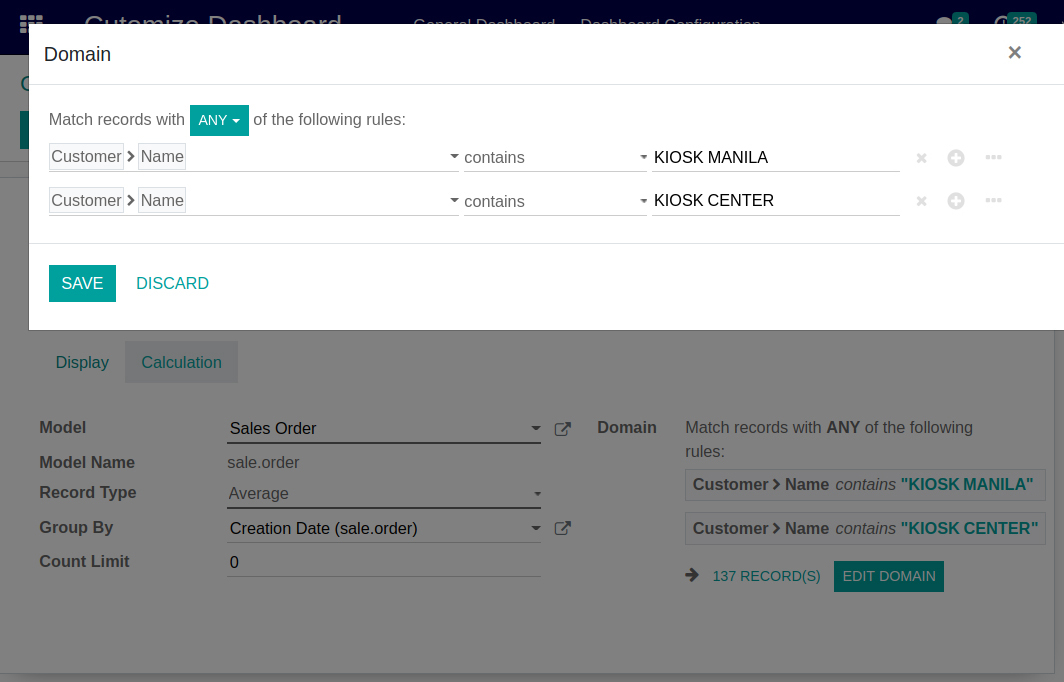
Edit Domain Option : There are Edit Domain button for Edit/Add “Match all records” criteria Filter option.
-
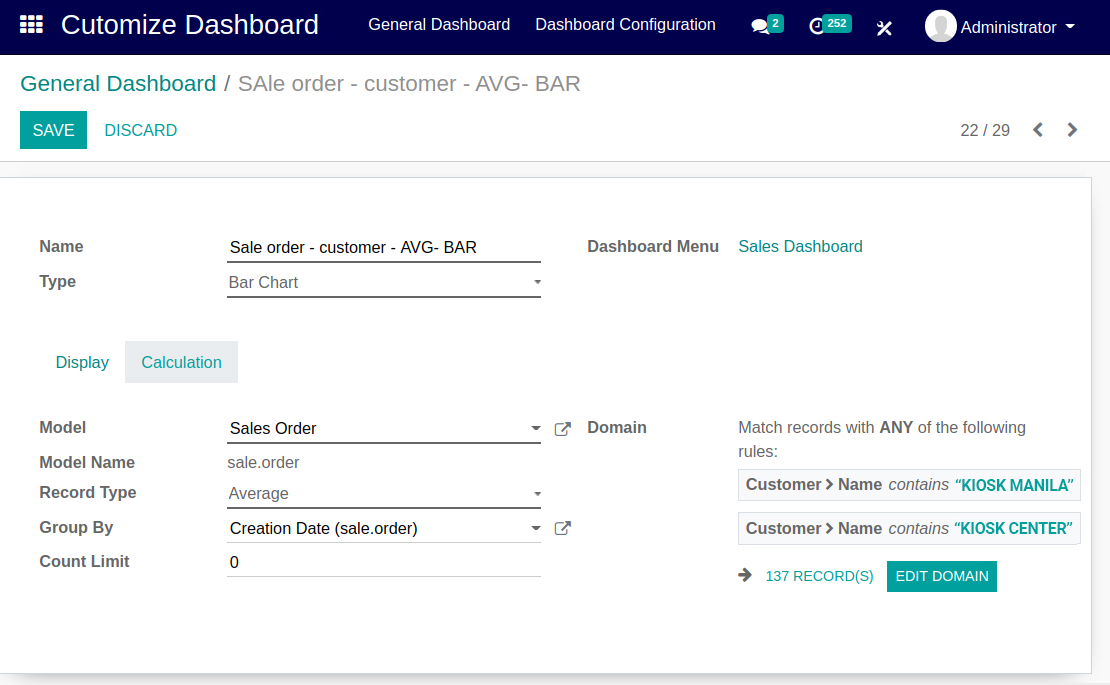
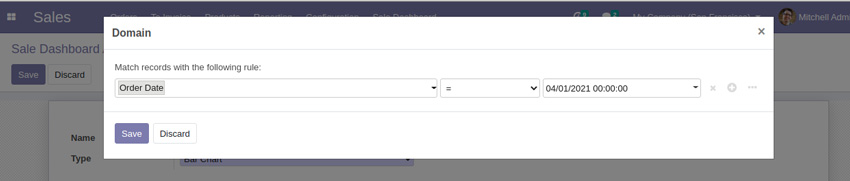
You can configure your sales data in Bar chart with vertical view to identify the sales in figures.
-
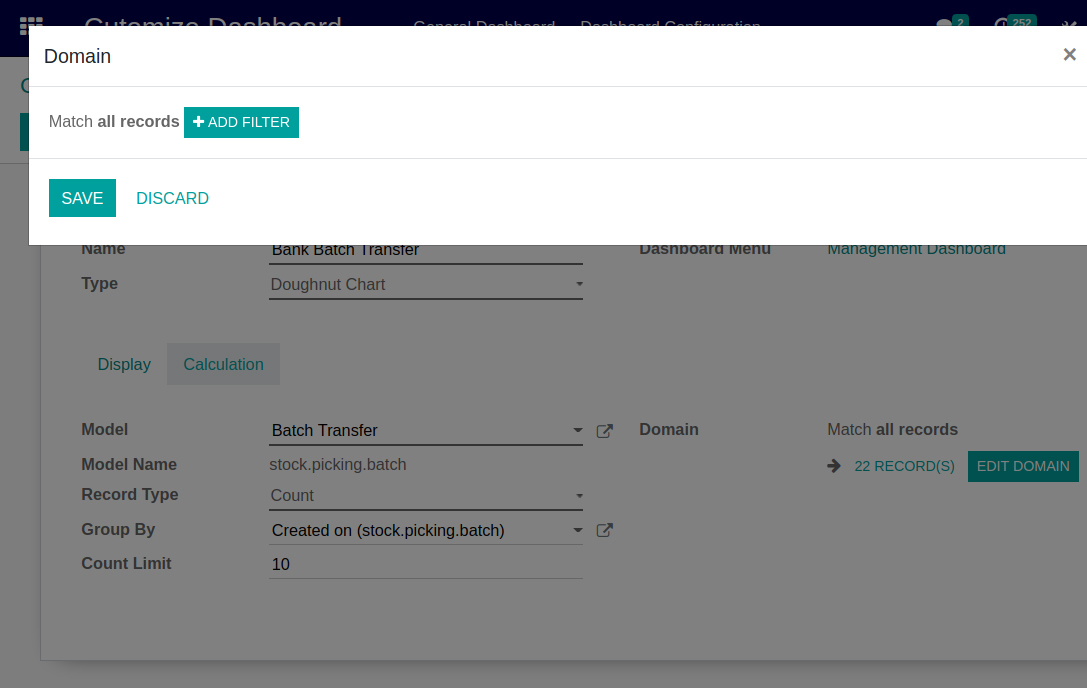
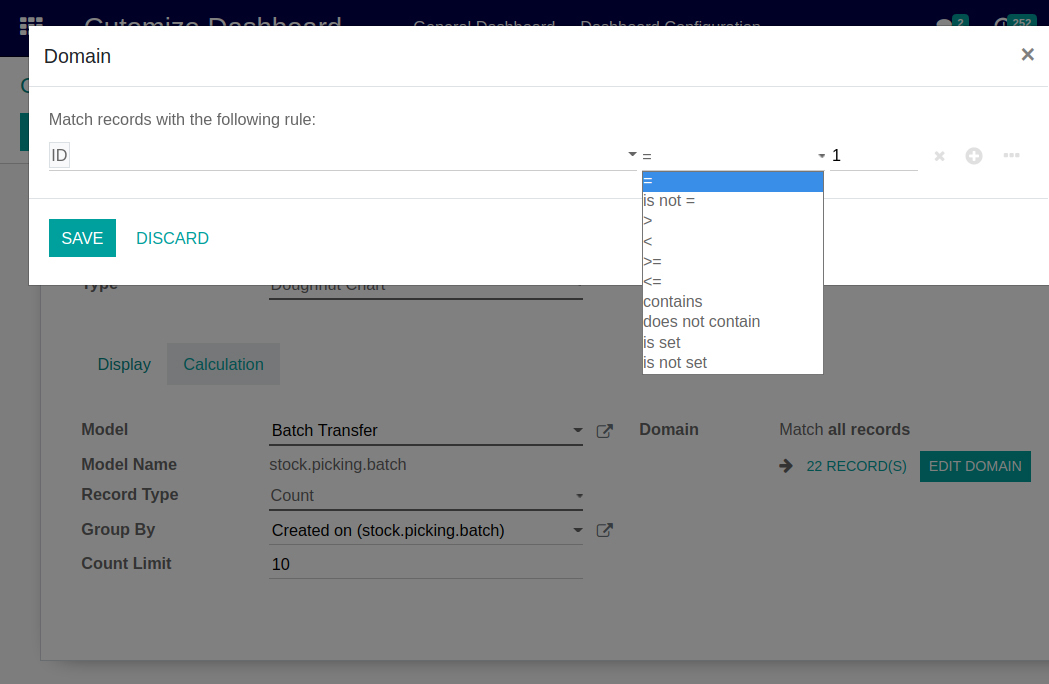
In Domain Filter there are search options available for searching fields, criteria domain for filter, other rule option with selection of equal, is not equal, greater than, less than, greater than equal, less than equal, contains, does not contain, is set, is not set options are available to selection as per your criteria to display chart, list view data.
-
In Domain Filter there are you can add multiple rules using plus(+) icon, remove any rule using cross(X) icon
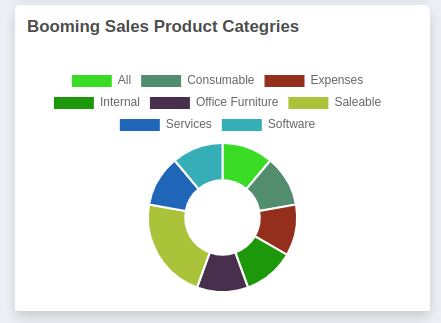
Doughnut Chart

Amaze Dashboard Supported Chart Types
-
01
Amaze dashboard supported Tile, Horizontal chart, Line chart, Bar Chart, Area Chart, Pie Chart, Doughnut Chart for managing dashboads data in different graphical view for analytical, visual representation and tracking purpose.
-
02
Dashboard can be a best way to visualize progress towards a goal for a sales , purchase, inventory, POS, CRM etc.
-
03
Transforming all kinds of business data into an effective visualization or dashboard is the first step towards to making an impact.
-
04
A Tile chart type that lets you display specific values like counts, sum.
-
05
Line Chart : The line chart is powerful for conveying changes over time. Line charts should be used to connect data along an interval scale which will show how data changes at equal intervals of time
-
06
Pie Chart : A pie chart is a type of chart that displays various data points in a circular fashion.
-
07
Bar Chart : A bar chart is one of the most common types of chart. They are a good option for summarizing data that is subset by categories.
-
08
Line Graph : A line graph is a chart type used to display the values or measurements of continuous data over time.
-
09
List View : A list of items with a data display in list view.
Title color & Fa icon & Background Setup
Set Title Text Color
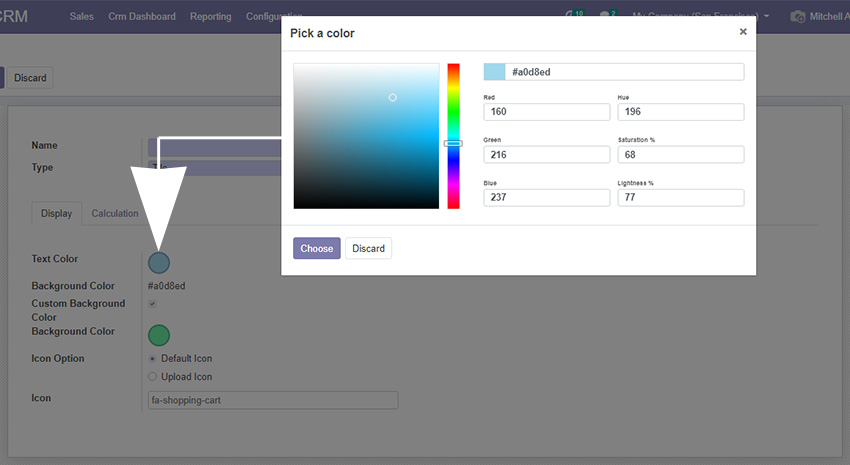
-
While creating new Chart/Graph there are section named “Display” for setup Text Title color to display Text with color in heading of Chart/Graph.
Set background Color
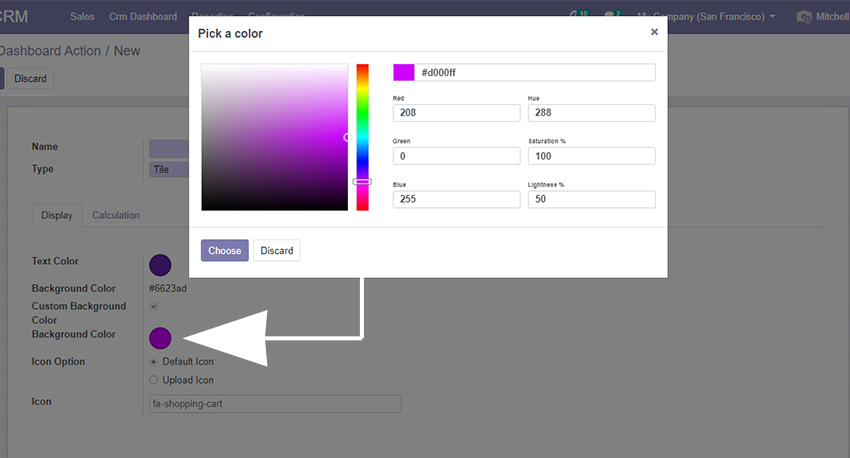
-
You can select Custom Background color to set in chart/Graph.
Add Fa icon in Title tab
-
Add your Custom Fa icon to display in Title tab for more specific view of chart
Drag to Resize the Charts
-
After setup your chart data selection you can edit layout in dashboard to drag and resize the chart view as per your needs.
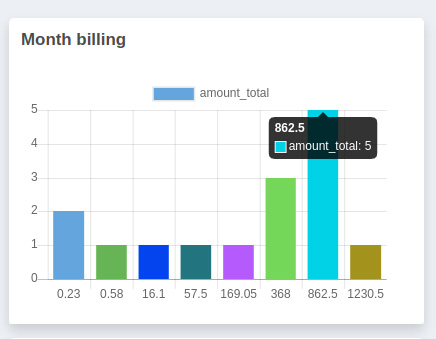
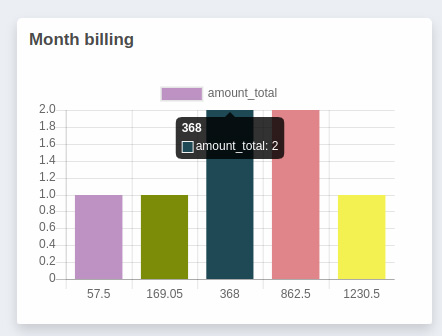
chart hover to display count
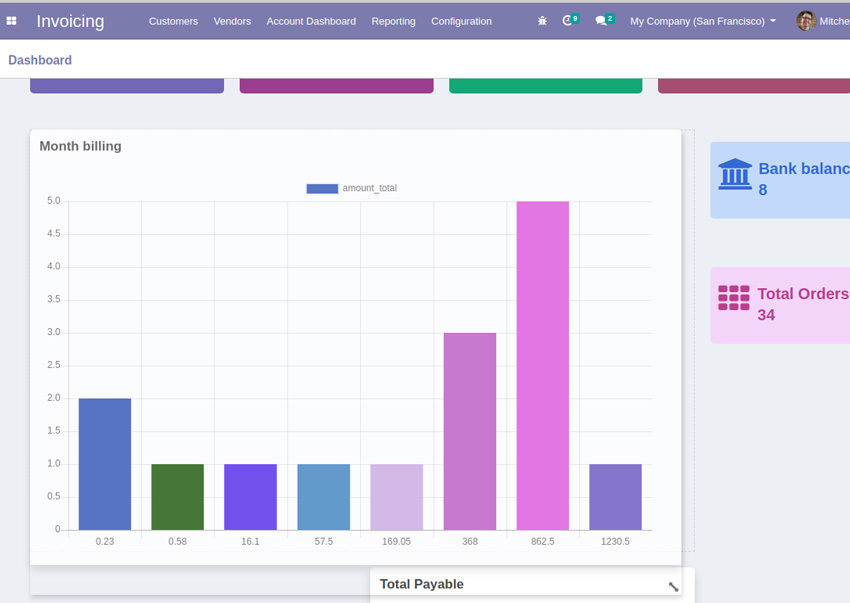
Bar Charts (Vertical & Horizontal)
Bar Chart-vertical
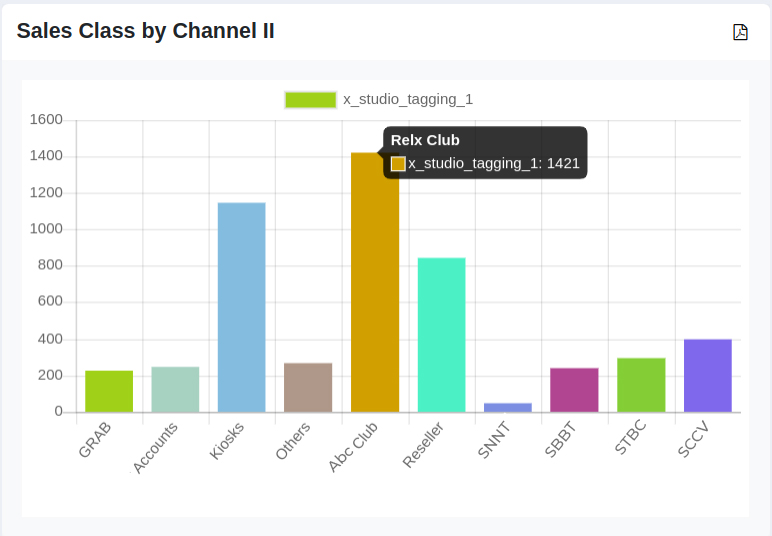
-
You can configure your sales data in Bar chart with vertical view to identify the sales in figures.
Bar Chart-horizontal
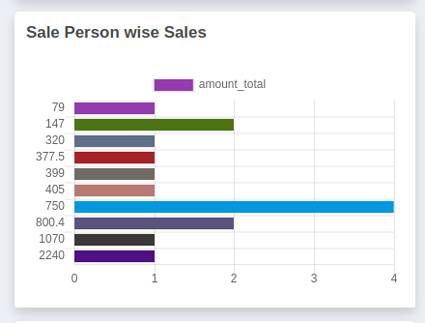
-
You can configure your sales data in Bar chart with Horizontal view to identify the sales by team.
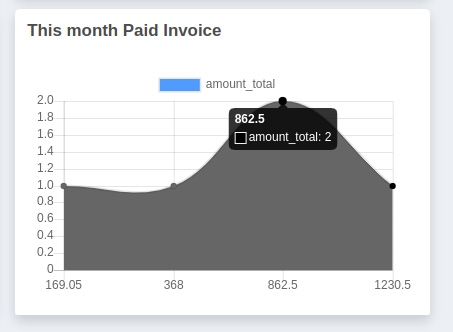
Line Chart & Pie Chart
Line Chart
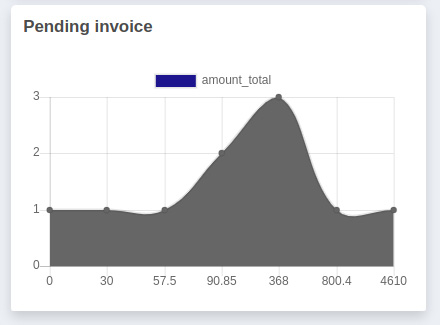
-
You can configure your Pending invoices data in Line chart view to identify the chart data in figures.
Chart Axis available in line chart
Pie Chart
-
Pie chart is the most choicable chart view for all types of data display in this circle view chart.
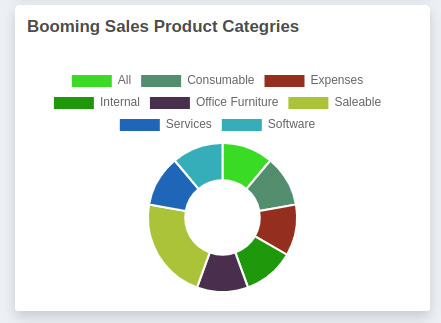
Doughnut chart Available
-
Doughnut chart Available for different data display. You can select Doughnut chart option to display chart data.
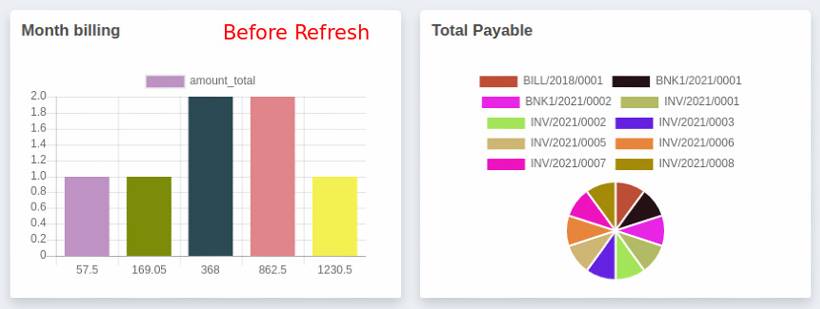
For Every Refresh New Colors reflected in Chart/Graph
Before Refresh Chart Color
-
Horizontal chart, Line chart, Bar Chart, Area Chart, Pie Chart, Doughnut Charts display with different colors in dashboard.
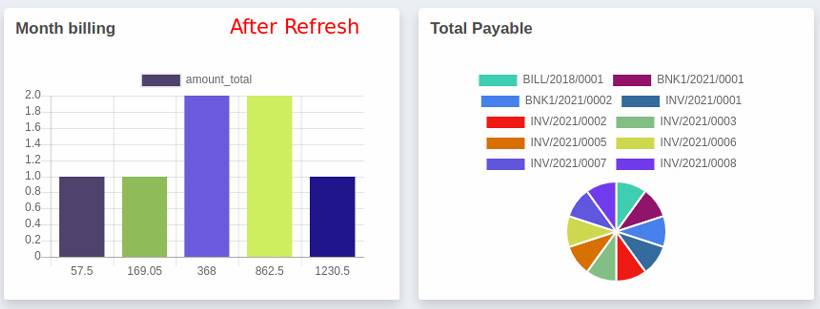
After Refresh Chart Color
-
When you refresh dashboard then Horizontal chart, Line chart, Bar Chart, Area Chart, Pie Chart, Doughnut Charts display with different colors.
Animated charts and Graph
-
Every time browser Refresh chart color will change with effect of animation
Add Fields, Domains, Filter
Configure Dashboard with custom fieds
Add fields, domains and filter options to create different Tile, charts/graphs , listview
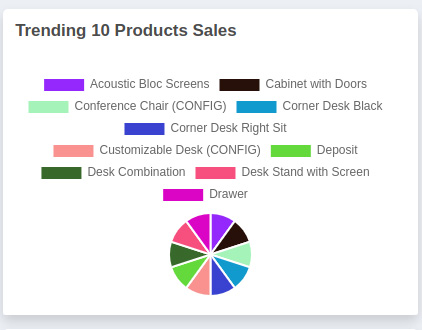
Create Top 10 products sell
-
Configure your top 10 sell products with different charts
Tile chart to display all Counts
-
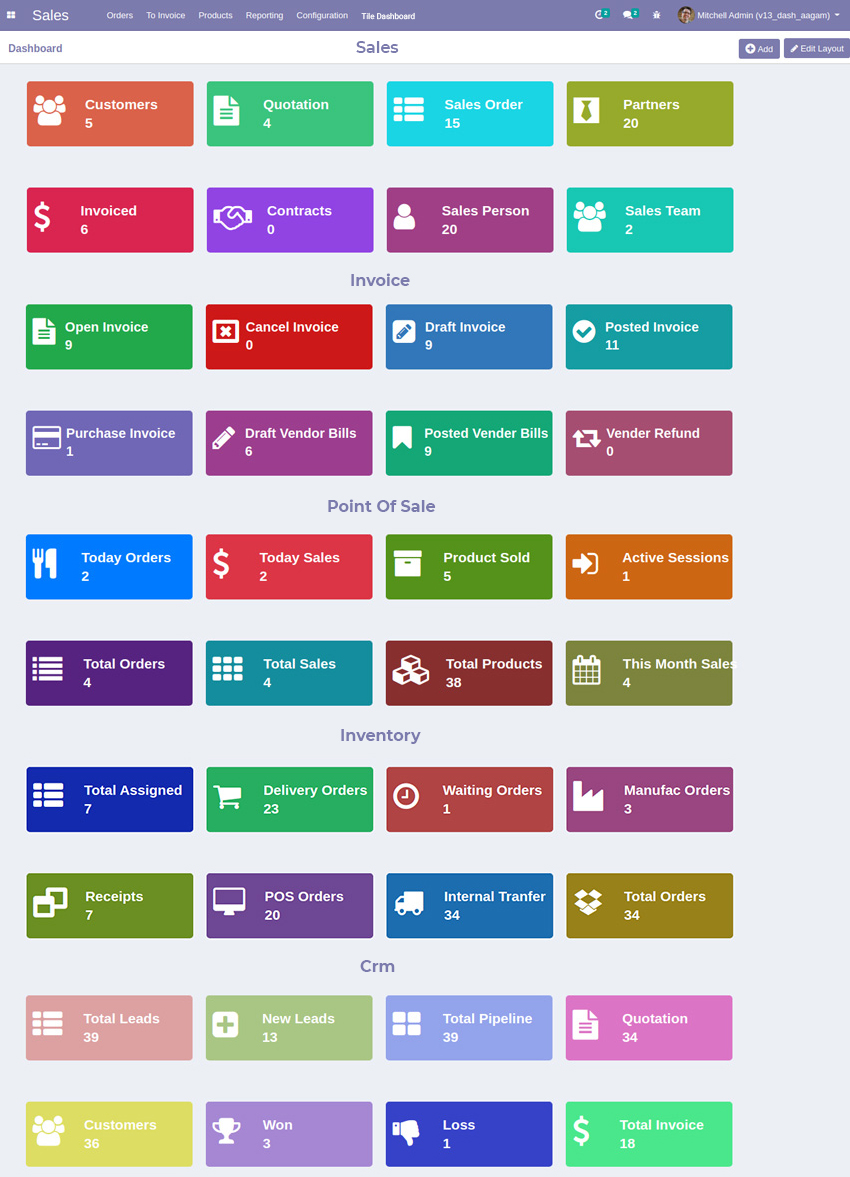
Configure Dashboard for all Tile chart data display.
5 Odoo Dashboard Templates
-
Sales, CRM, POS, Inventory, Account Dashboard.
Big Screen supported
-
We have made dashboards responsive, so it support, all mobile devices, Tablet, Laptop view, Large screen, TV View for display and presentation.
Amaze Odoo Dashboard Demo Available
Super Easy to Integrate into your odoo system, Amaze Odoo Dashboard access from any web browser, on desktop, tablet or mobile device. visualize and combine all your data from a lot of sources and build a dashboard that helps you to display a combination of site metrics, dyamic data insights, graph, chart.
Send mail to get DEMO – business@aagaminfotech.com
SCREENSHOTS
Dashboard Configuration
Configure Dashboard Item
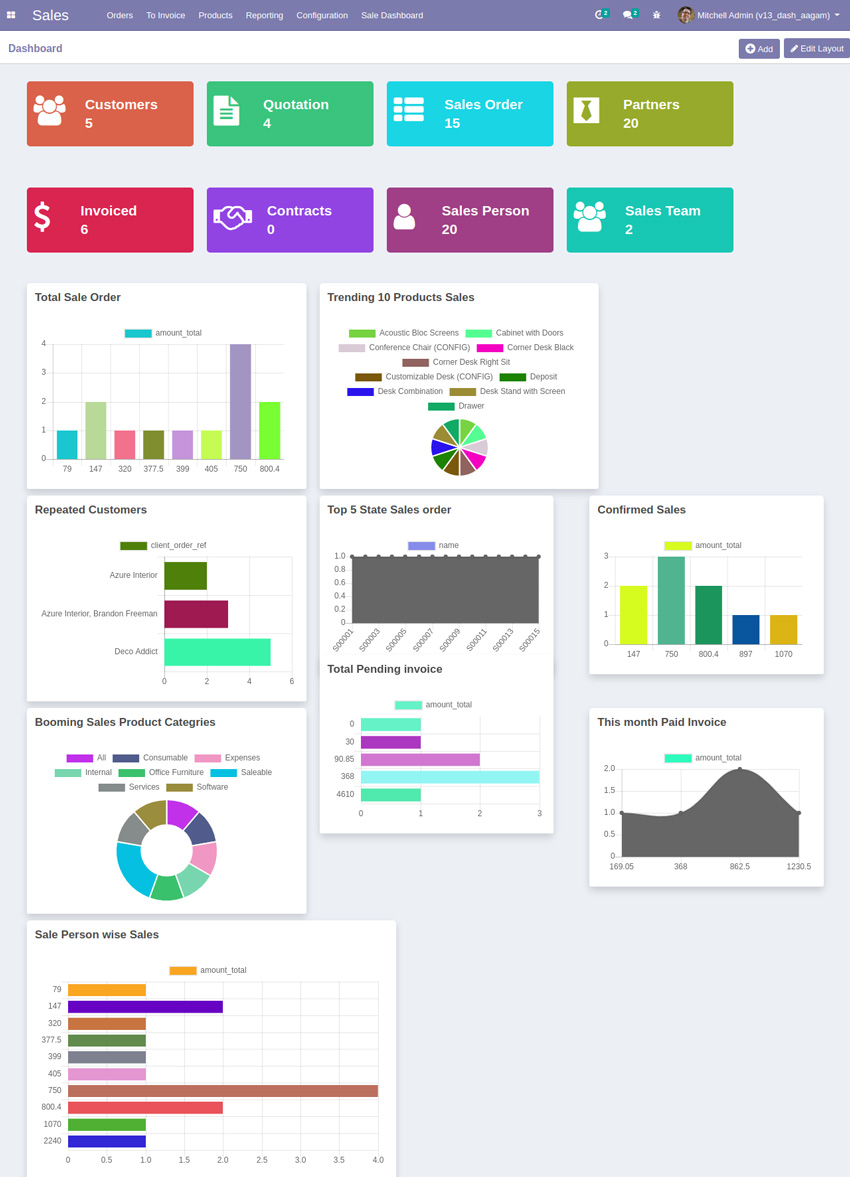
View of Sales Dashboard in odoo
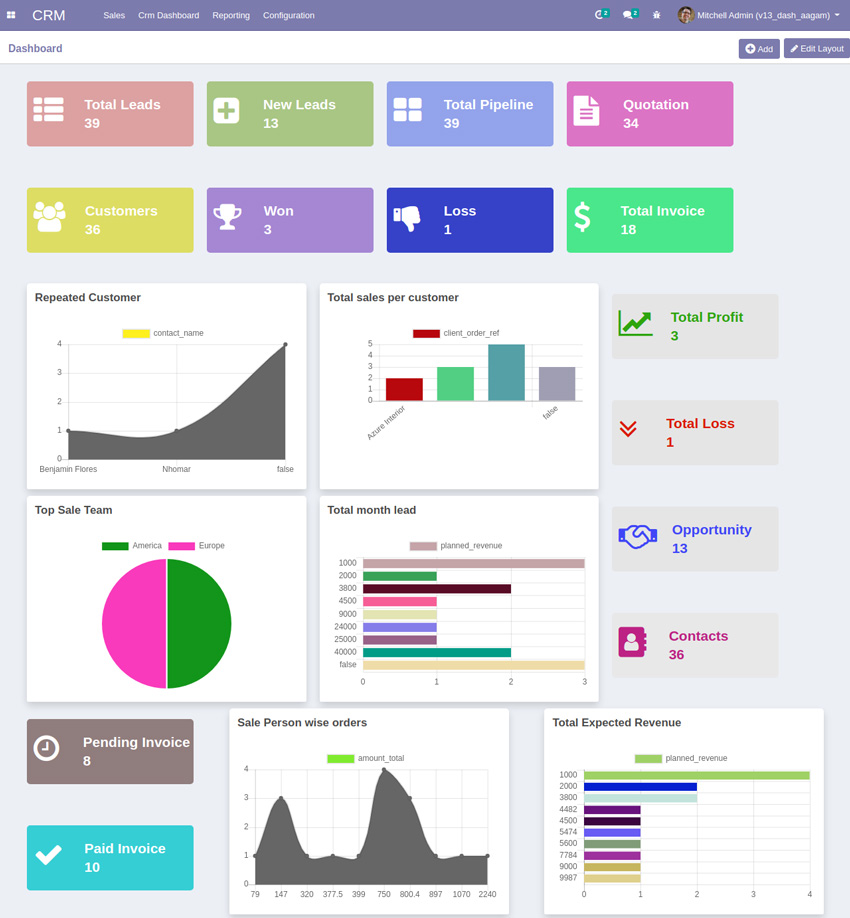
View of CRM Dashboard in odoo
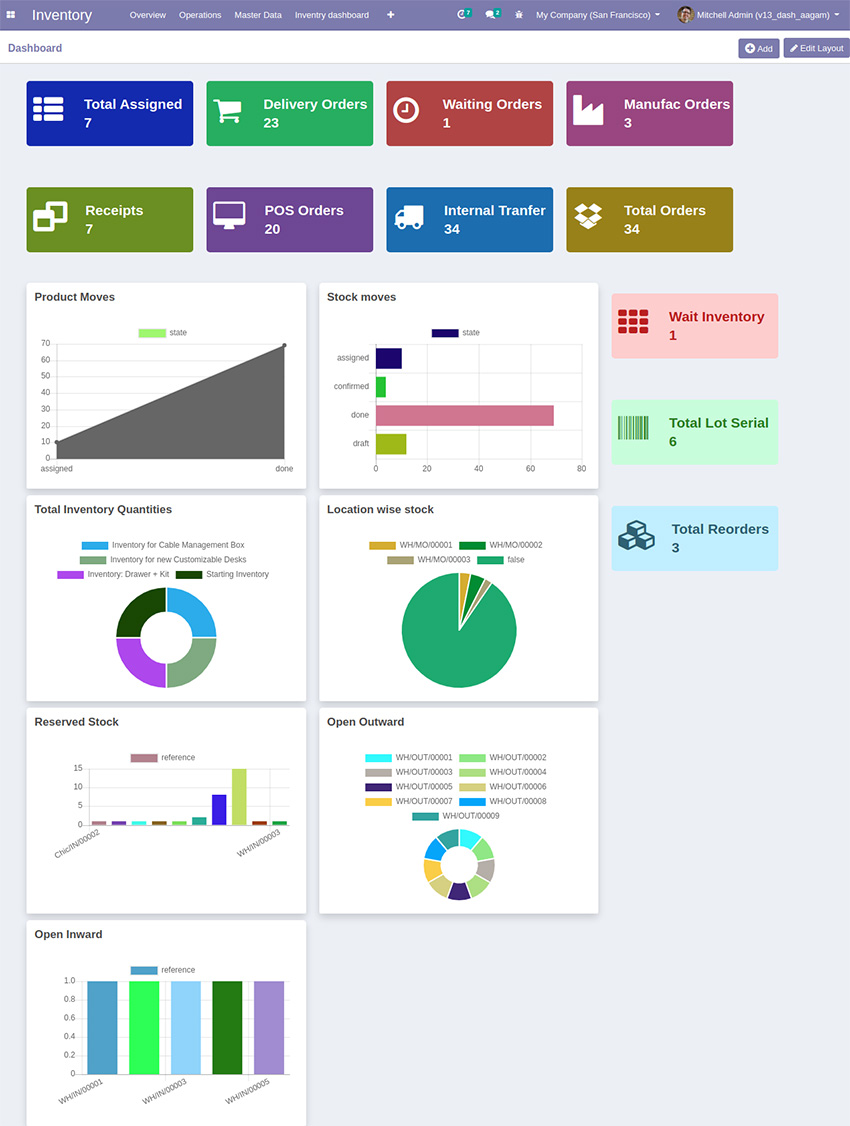
View of Inventory Dashboard in odoo
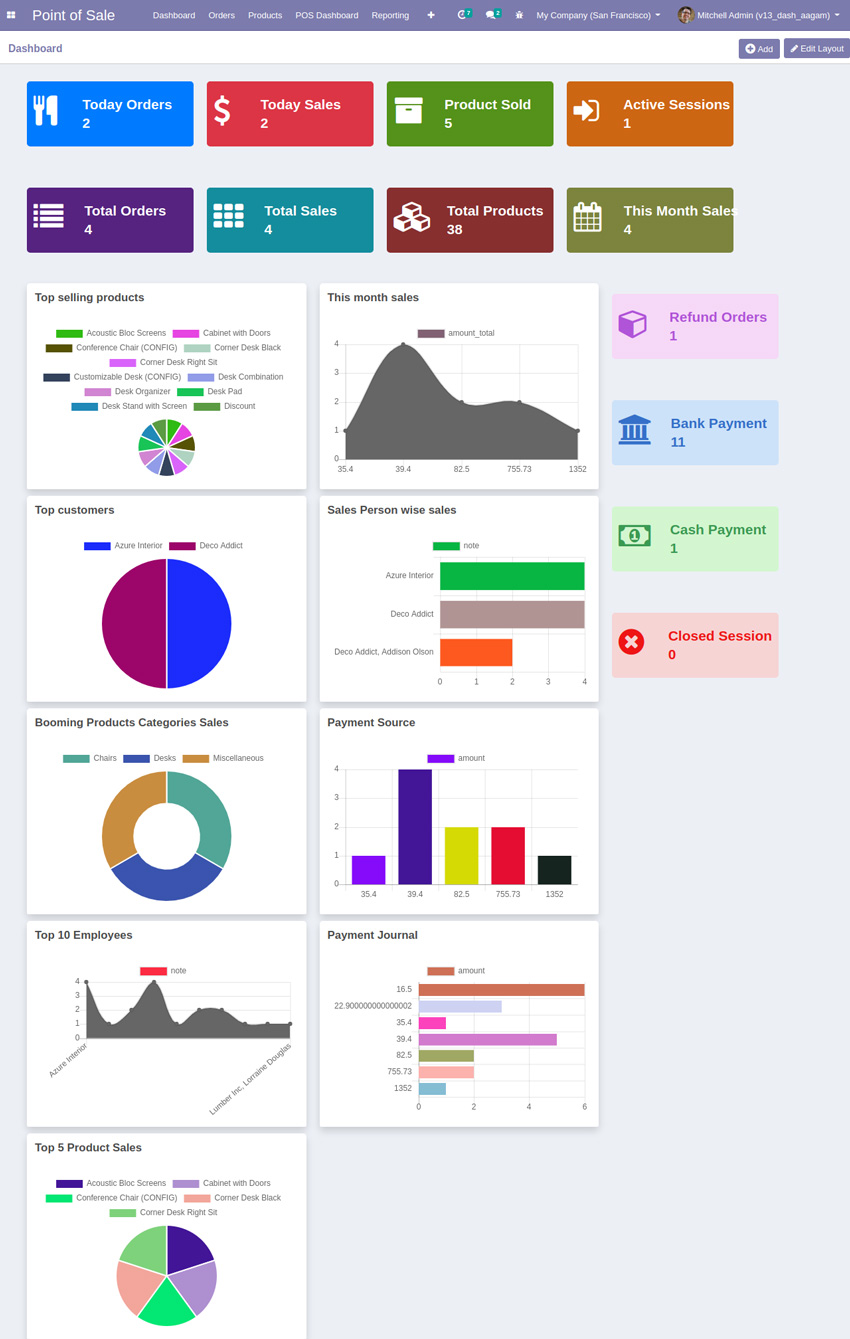
View of Point of Sale Dashboard in odoo
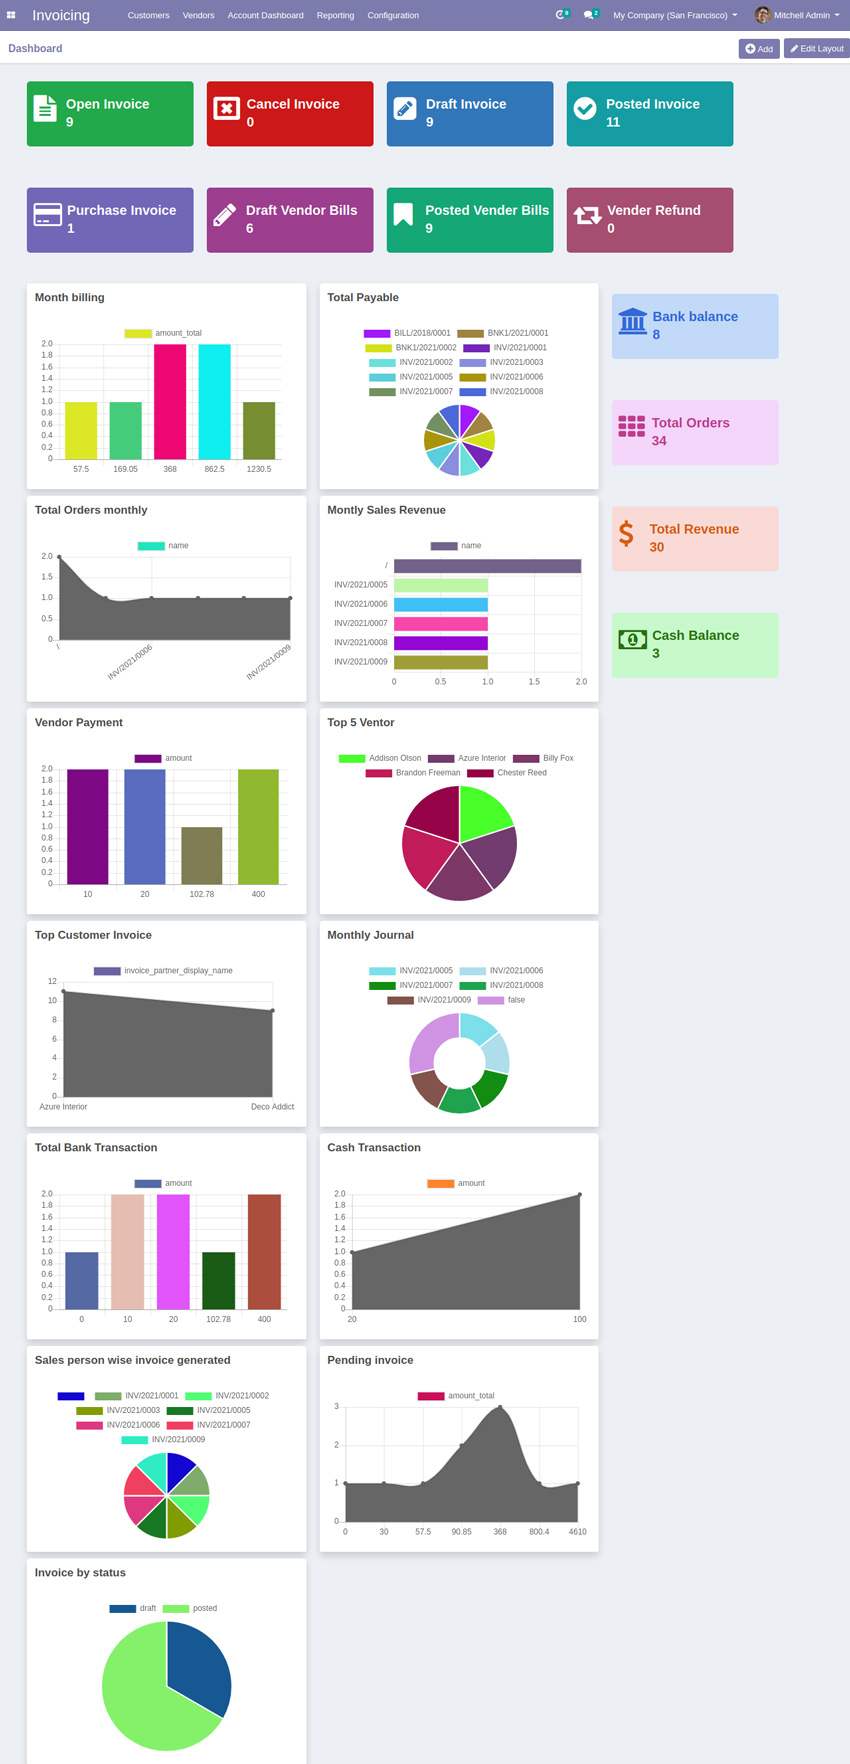
View of Account Dashboard in odoo
For Technical Help and Support
Aagam Infotech company having expertise in odoo application development, odoo community and enterprise development, odoo ERP customization, odoo integration, migration, cost-effective odoo development.
If you need expert advice in making technological choices in ODOO and/or external Odoo ERP Implementation Consultants to define your organizational specifications, we are here to assist you please contact us at